

 II
II
How Tracking Works
What Proferex counts from ad to sale, and how to use it to find what makes money.
This page explains what the numbers in your reports mean and how to use them to decide where your ad budget goes.
From ad to sale
Every campaign takes people through the same steps. They see your ad, land on your page, go to the offer, and some of them buy. Proferex counts each step.
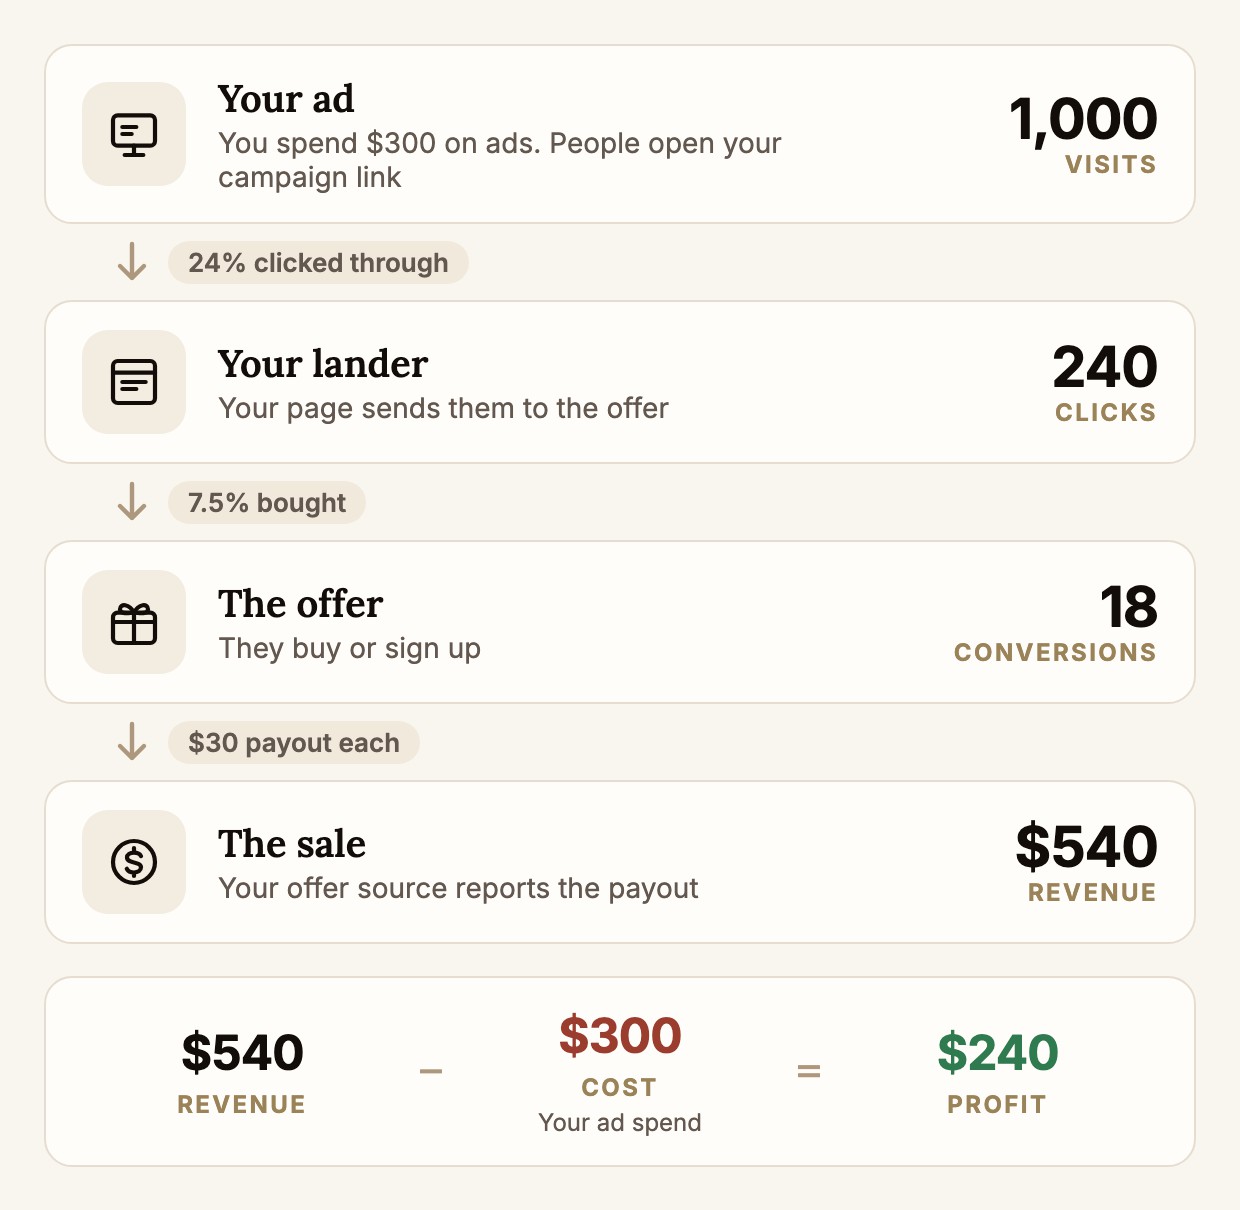
Each step has its own column in your reports.
| What happens | Column |
|---|---|
| Someone clicks your ad and opens your campaign link | Visits |
| They click the button on your lander and go to the offer | Clicks |
| They buy or sign up | Conversions |
| Your offer source reports the payout | Revenue |
Cost is your ad spend, the money you paid your traffic source for those visits. In the example, $300 of ads brought in 1,000 visits. Profit is revenue minus cost.
A click is always a move from your lander to the offer. Here, it is the visitor pressing Get The Offer.
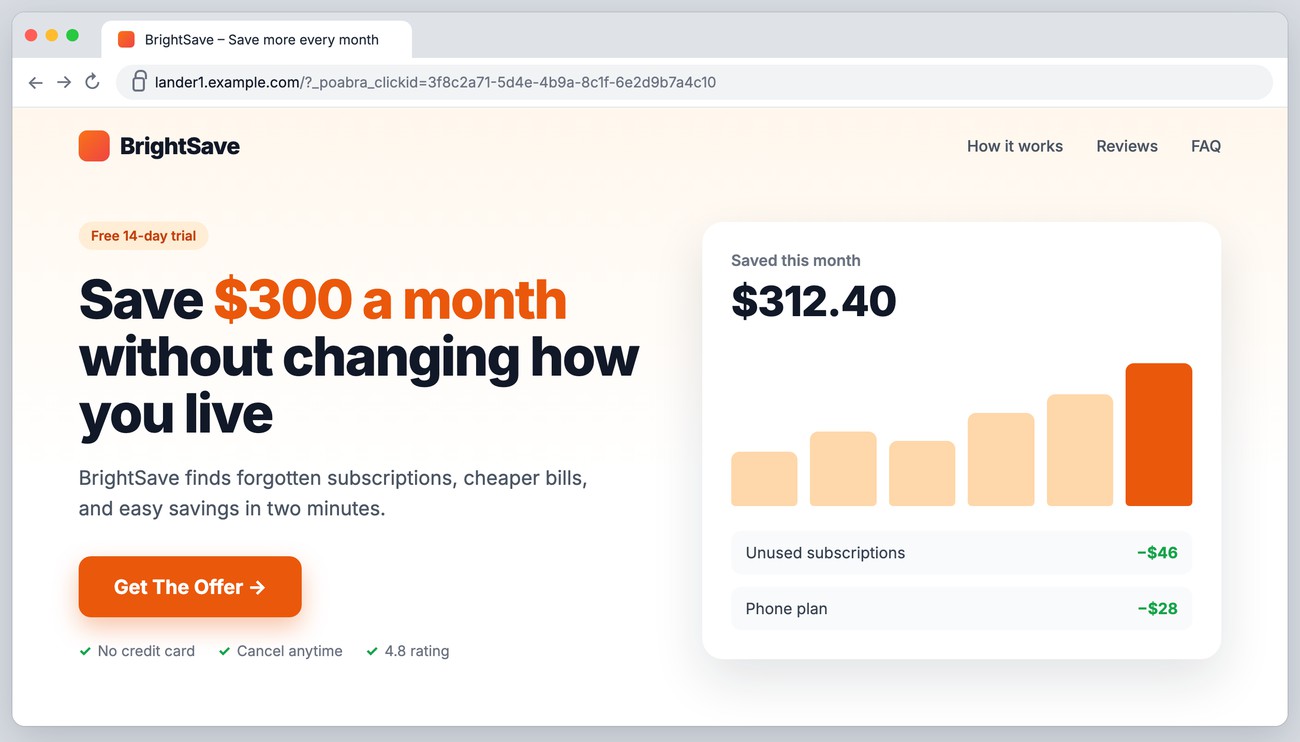
If a campaign sends people straight to the offer with no lander, there is nothing to click through. You see visits and conversions, but no clicks.
Reading your Campaigns page
The Campaigns page puts these numbers side by side for every campaign. It updates within a minute.
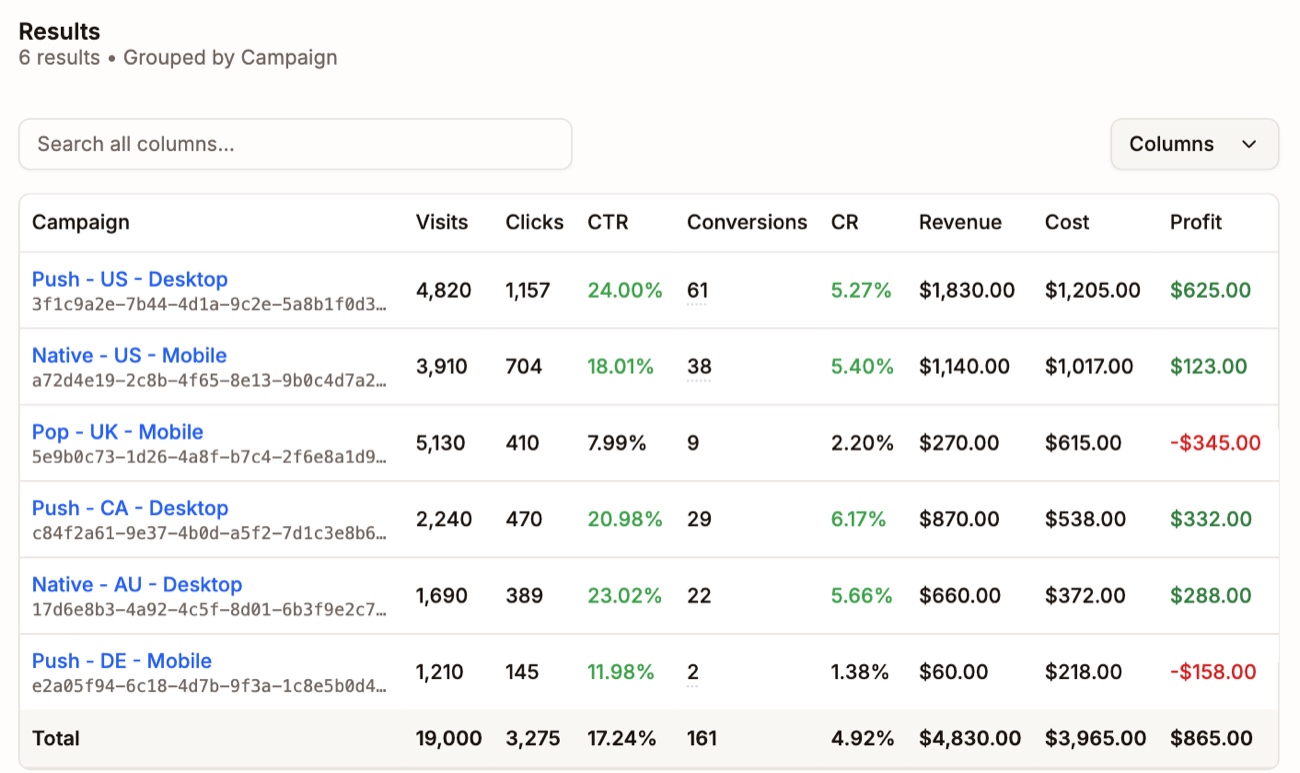
Look at the two outlined rows.
Pop - UK - Mobile had the most traffic, over 5,000 visits. Fewer than 8% of those people clicked through to the offer, and only 9 bought. It lost $345.
Push - US - Desktop had fewer visits but made $625. About 1 in 4 visitors clicked through, and 61 bought.
The UK campaign got plenty of people to the page, but few of them cared. Try a different lander there first. If that does not help, the audience may not suit the offer, and the budget is better spent on the US campaign.
The percentages to watch
Totals grow as you spend more. A campaign with ten times the budget will have more of everything, so totals cannot tell you which one is doing better. Percentages can.
| Column | What it tells you | If it is low |
|---|---|---|
| CTR | How many visitors clicked through to the offer | Your lander is not convincing this audience |
| CR | How many of those clicks turned into a sale | The offer does not suit this audience |
| EPV | Revenue for each visit | Compare it with CPV. If it is lower than CPV, you lose money |
| CPV | How much you pay for each visit | It only matters next to EPV |
| ROI | Profit compared with what you spent | Below 0% means you are losing money |
Testing one thing against another
Every traffic source, lander, and offer gets the same columns. That lets you run two side by side and keep the better one. The offer usually makes the biggest difference, so it is a good place to start.
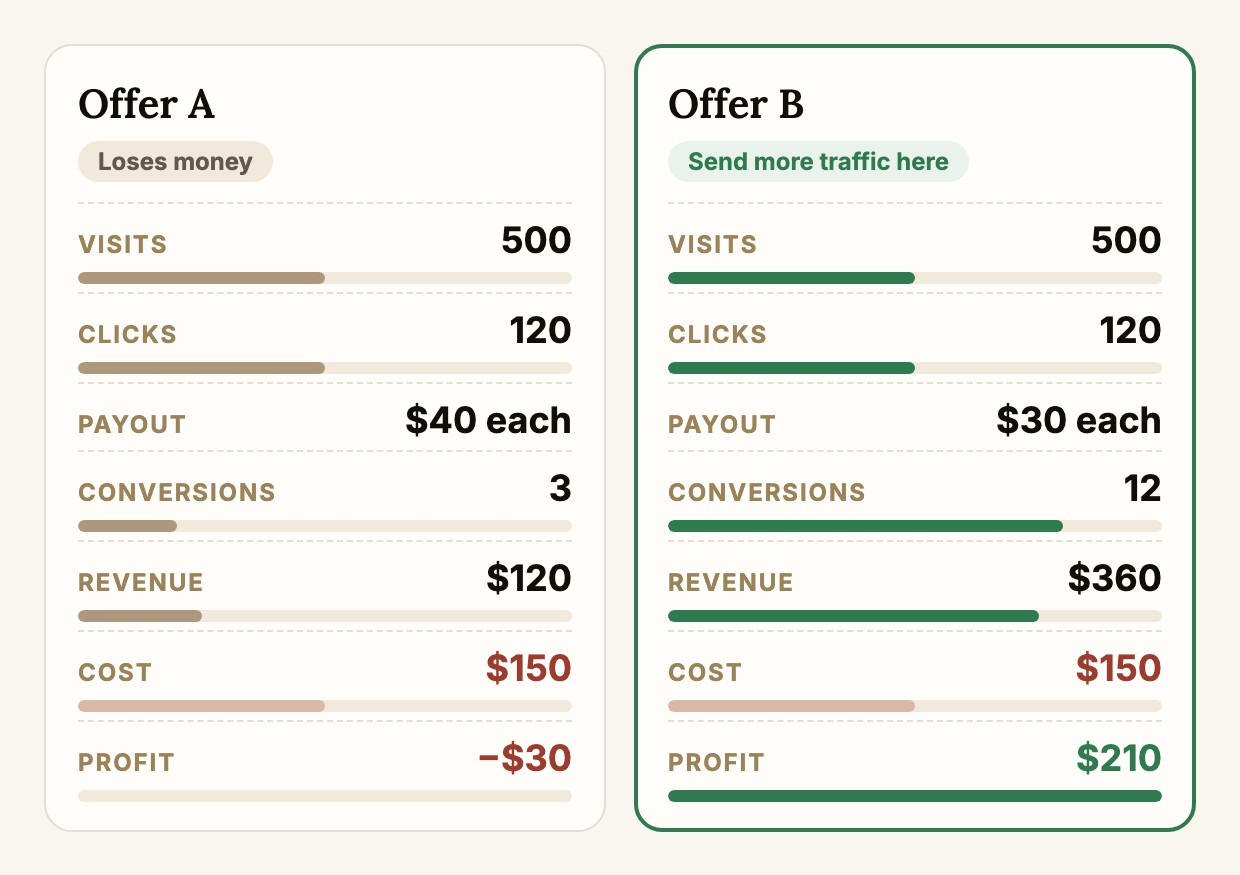
Both offers got the same visitors from the same lander, for the same money. Offer A pays more for each sale, but only 3 people bought, so it lost $30. Offer B pays less, sold 12, and made $210.
A high payout is worth nothing if your audience does not buy. Compare offers by EPV, the revenue each visit brings in, not by payout. Then move the traffic to the winner and test a new offer against it.
Things worth testing:
- Offers. Send the same lander to two offers. Keep the one with the higher EPV.
- Landers. Split one campaign's traffic between two landers. Keep the one with the higher CTR and profit. See Combinations.
- Traffic sources. Run the same lander and offer on two traffic sources. Spend more where ROI is higher.
- Audiences. In Analytics, split the numbers by country, device, time of day, and more. You will often find one country or device making all the money while another loses it.
Give each test enough traffic before you pick a winner. With only a handful of conversions, one lucky sale can make the wrong side look better.
What you need for every column
Visits and clicks show up as soon as people use your campaign link.
Conversions and revenue need your offer source to tell Proferex when someone buys. This is called a postback. Without it, you see traffic but no sales. Step 8 of the Quick Start sets it up.
Cost comes from your traffic source. See Costs.
Key terms
The numbers in your reports:
| Term | Meaning |
|---|---|
| Visit | Someone opening your campaign link |
| Click | A visitor going from your lander to the offer |
| Conversion | A sale, sign-up, or other result your offer source pays for |
| Revenue | The payout your offer source reports for your conversions |
| Cost | What you paid your traffic source for the visits |
| Profit | Revenue minus cost |
The parts you set up:
| Term | Meaning |
|---|---|
| Campaign | The link you put in your ad. Everything that happens after someone opens it is counted under that campaign |
| Traffic source | Where your visitors come from, such as an ad network |
| Lander | Your own page, shown before the offer. Optional |
| Offer | The product or service you promote |
| Offer source | The affiliate network or advertiser that runs your offers and pays you |
| Combination | The landers and offers a campaign sends people to, and how the traffic is split between them |
| Postback | A URL your offer source calls when someone converts. It tells Proferex which visitor converted and what the payout was |
Next step
Build a campaign and watch these numbers fill in with the Quick Start.